Provider Admin Flow
Login
Platform Admin can login using SSO (Single Sign On) or NEO Login
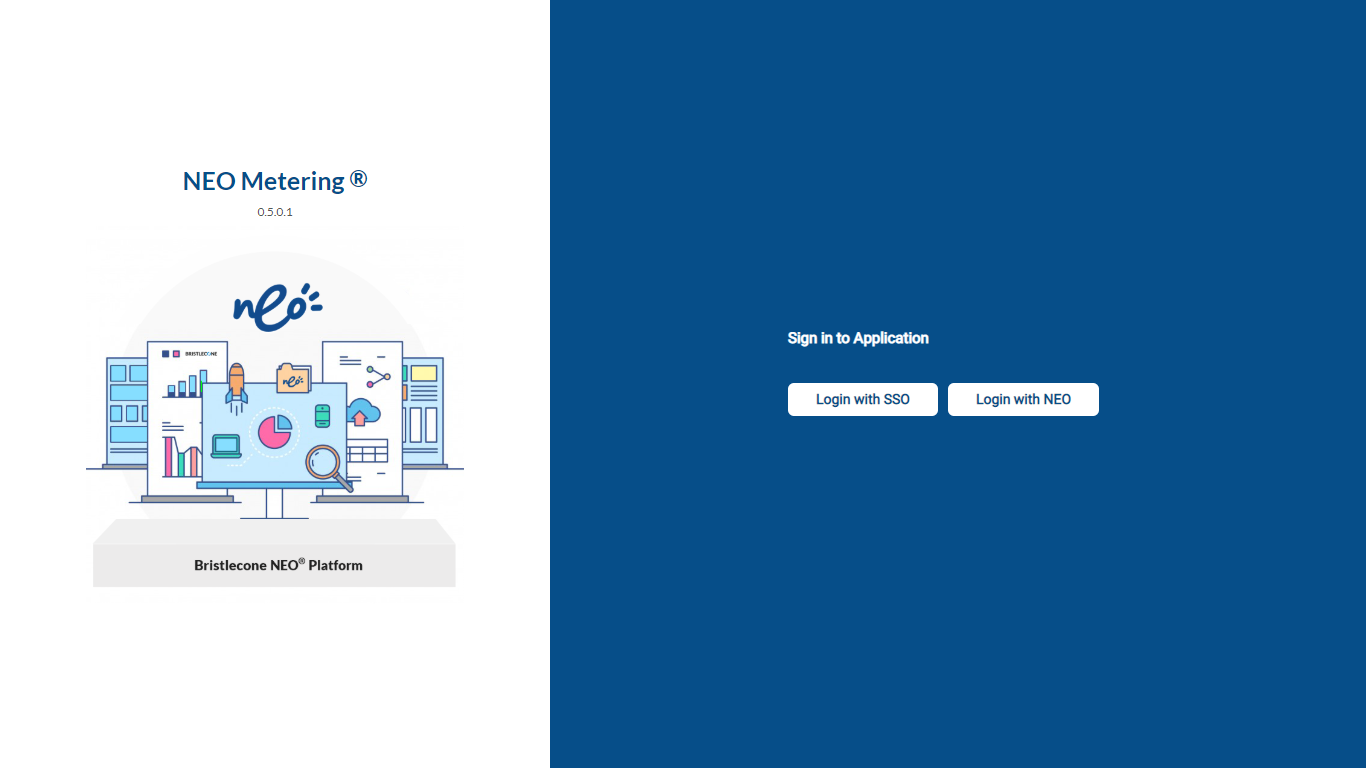
After successful login, the user will be redirected to NEO® Metering landing page
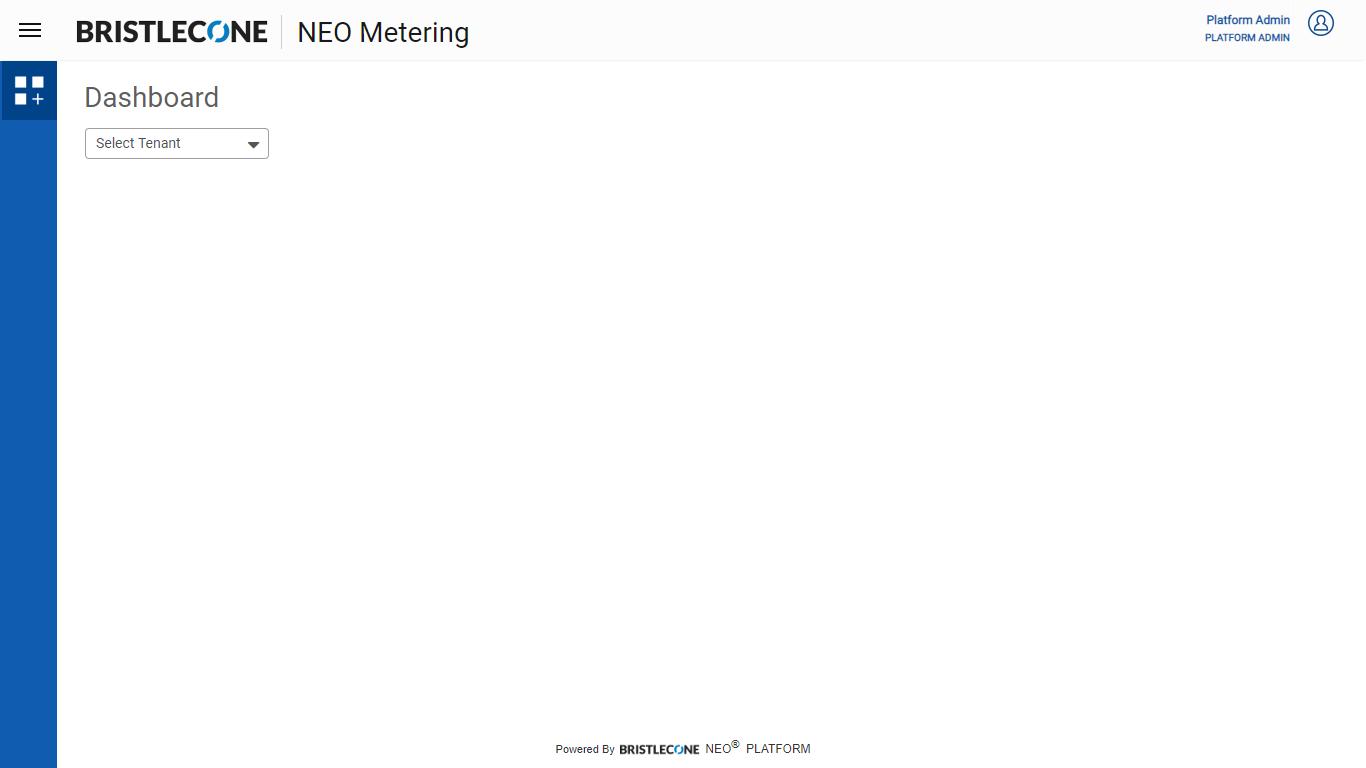
Select Tenant
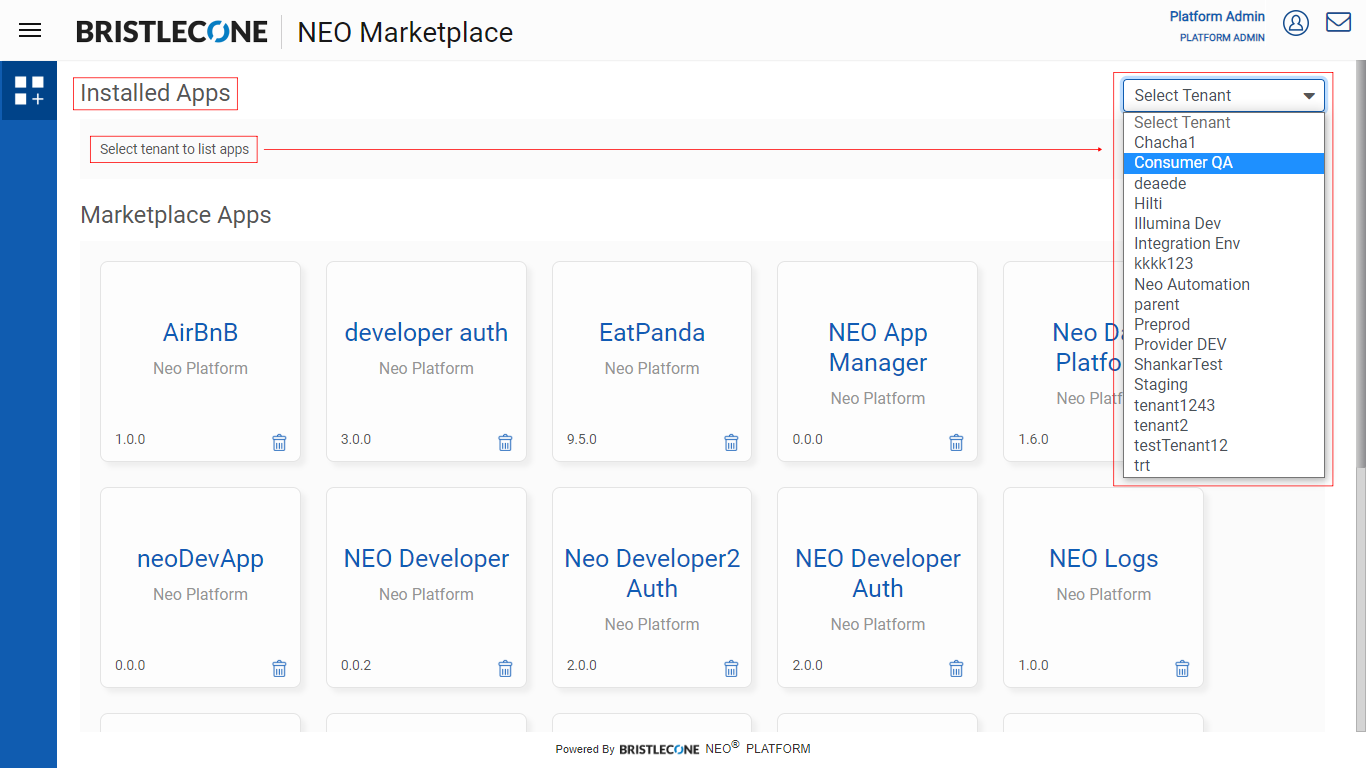
Platform Admin will be able to view the list of all tenants from the Select Tenant drop down list. To view the usage of a tenant, select the tenant name
Once the tenant is selected, the below screen will show
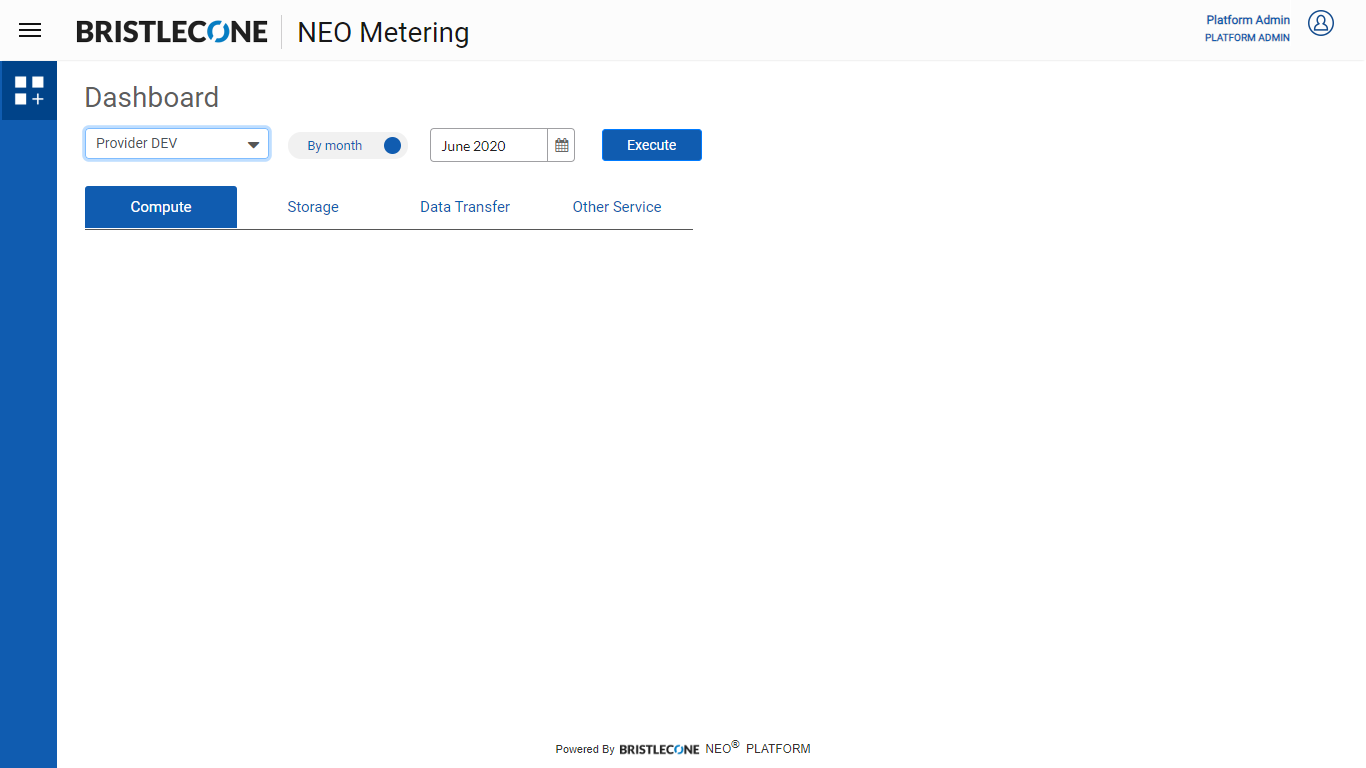
View Usage
To view the usages of the selected tenant, Platform Admin has two options to view the reports based on By Month or By Date Range.
By Month
As a default setting, By Month will be selected as current month. To choose different month, Click on calendar icon to choose a month as shown below
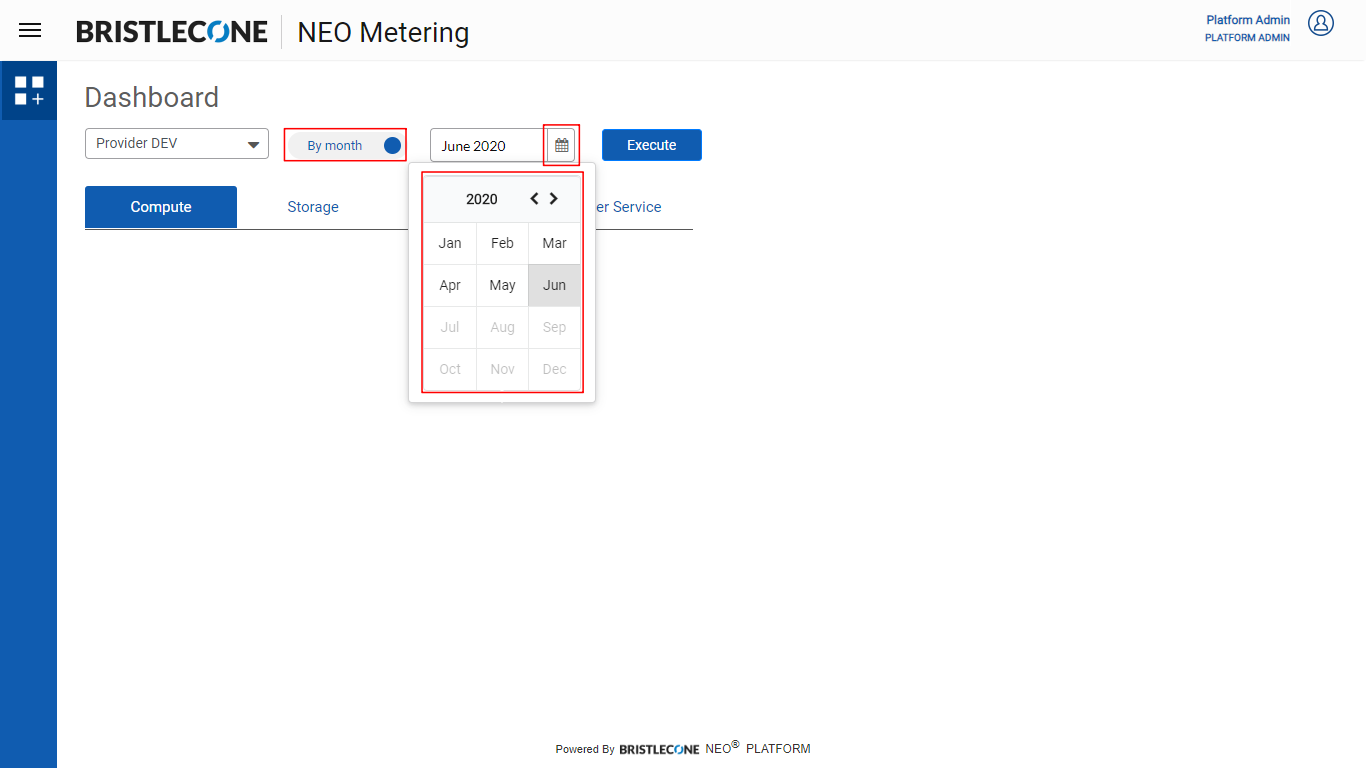
Note : Platform Admin user can select the date max of range 12-13 months behind from current date
To view the report, Platform Admin can click on Execute button
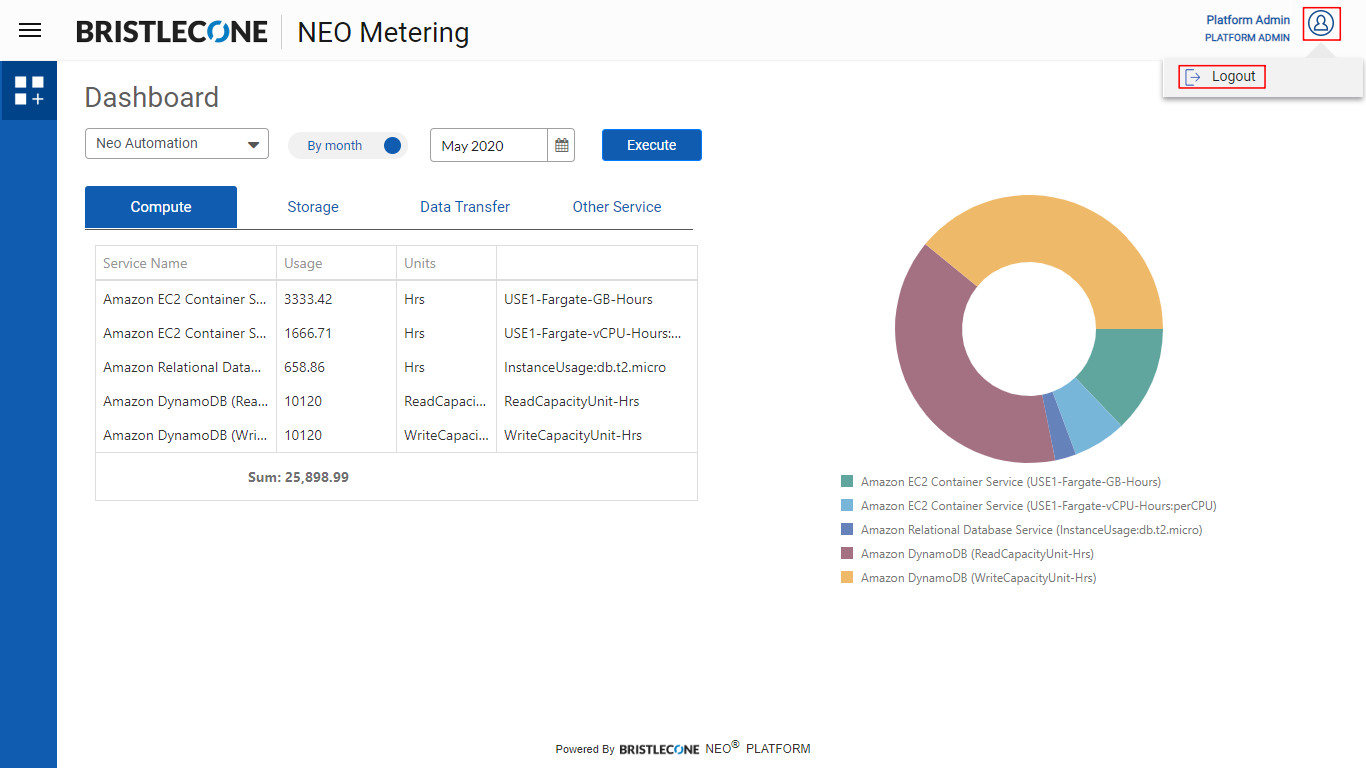
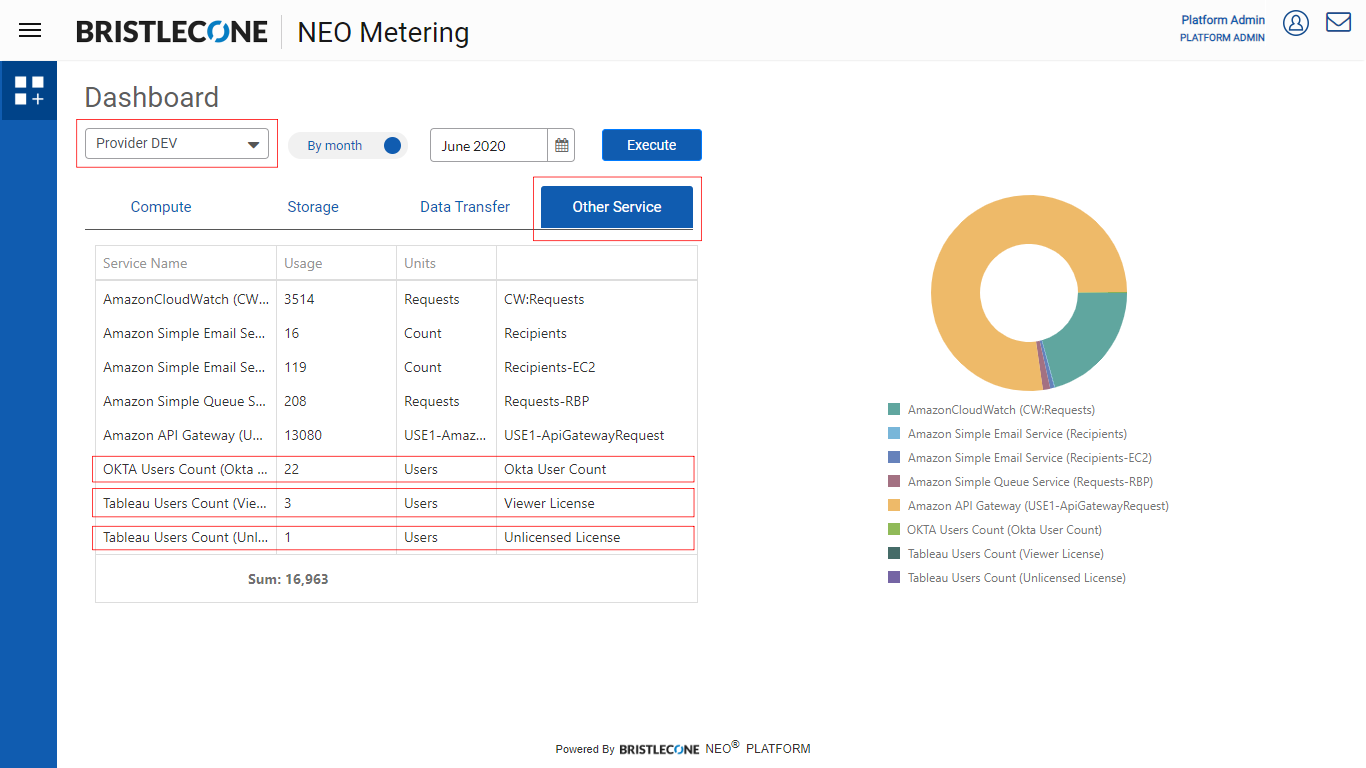
Post click, the dashboard will appear with usage details along with Pie chart as shown below:
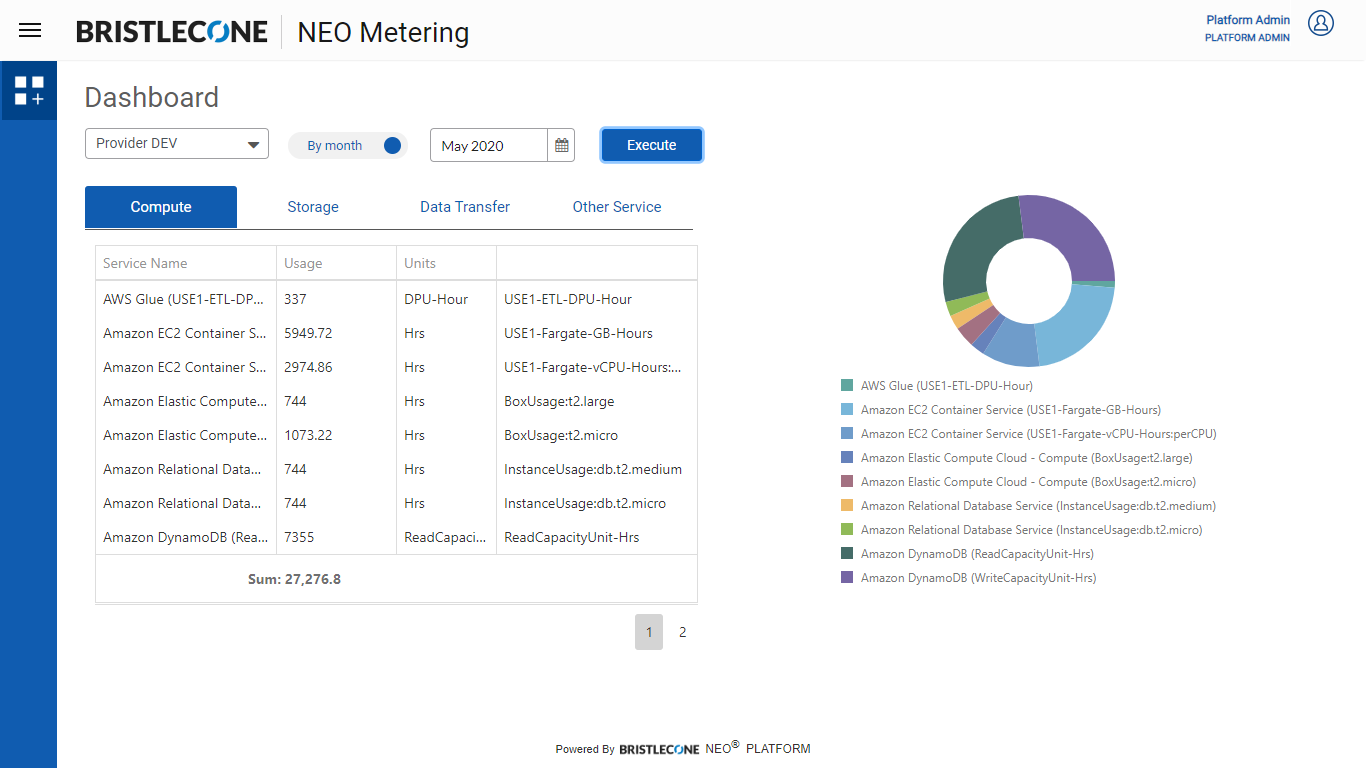
Platform Admin can switch between different tabs (Compute, Storage, Data Transfer and Other Services) to check the related Services Name and their usages, units and description in a table view. For each tab the related pie chart will appear on the right side of the screen. Hovering mouse on the different color of the pie chart will show brief details about the service.
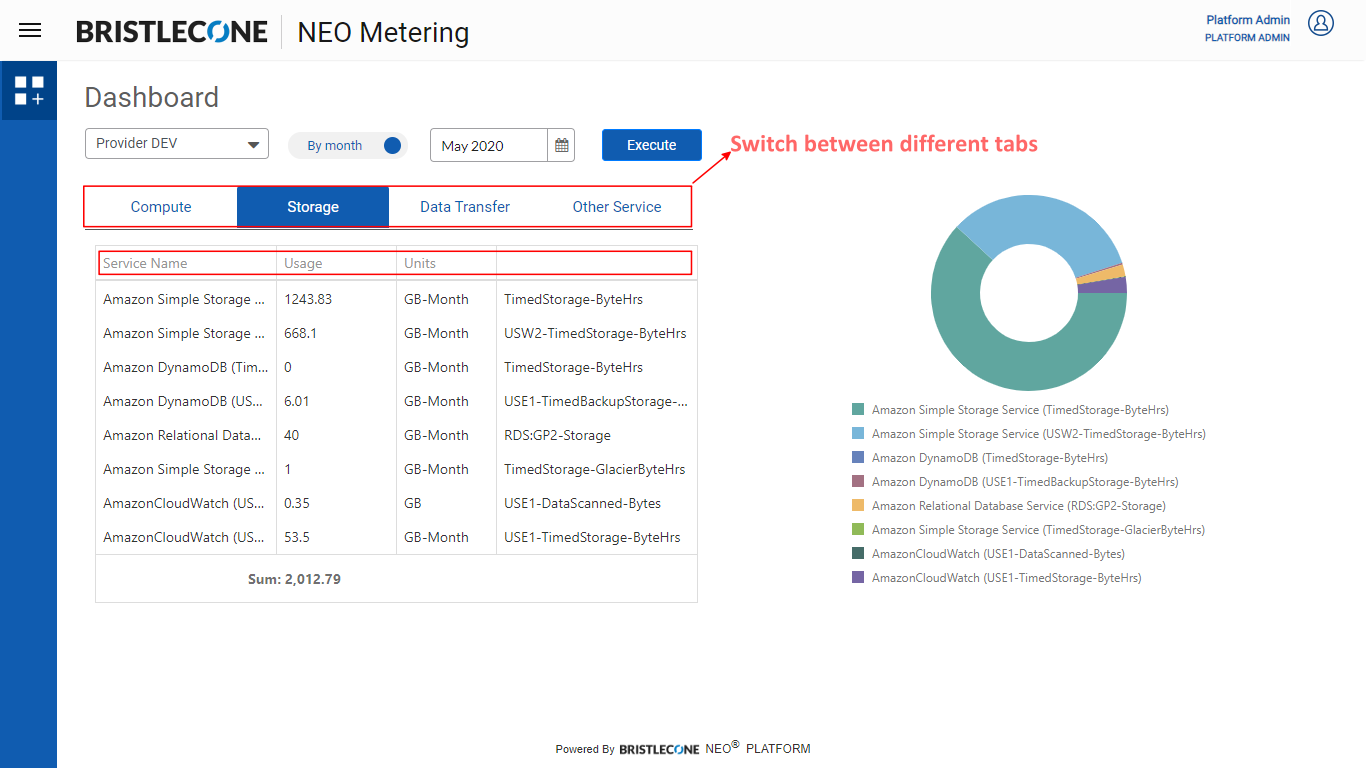
Note : Data Transfer section is still under development. No data can be seen under this tab
Platform Admin can view the number of OKTA Users Count, Tableau Users Count (Licensed, Unlicensed) of a Tenant from Other Service tab
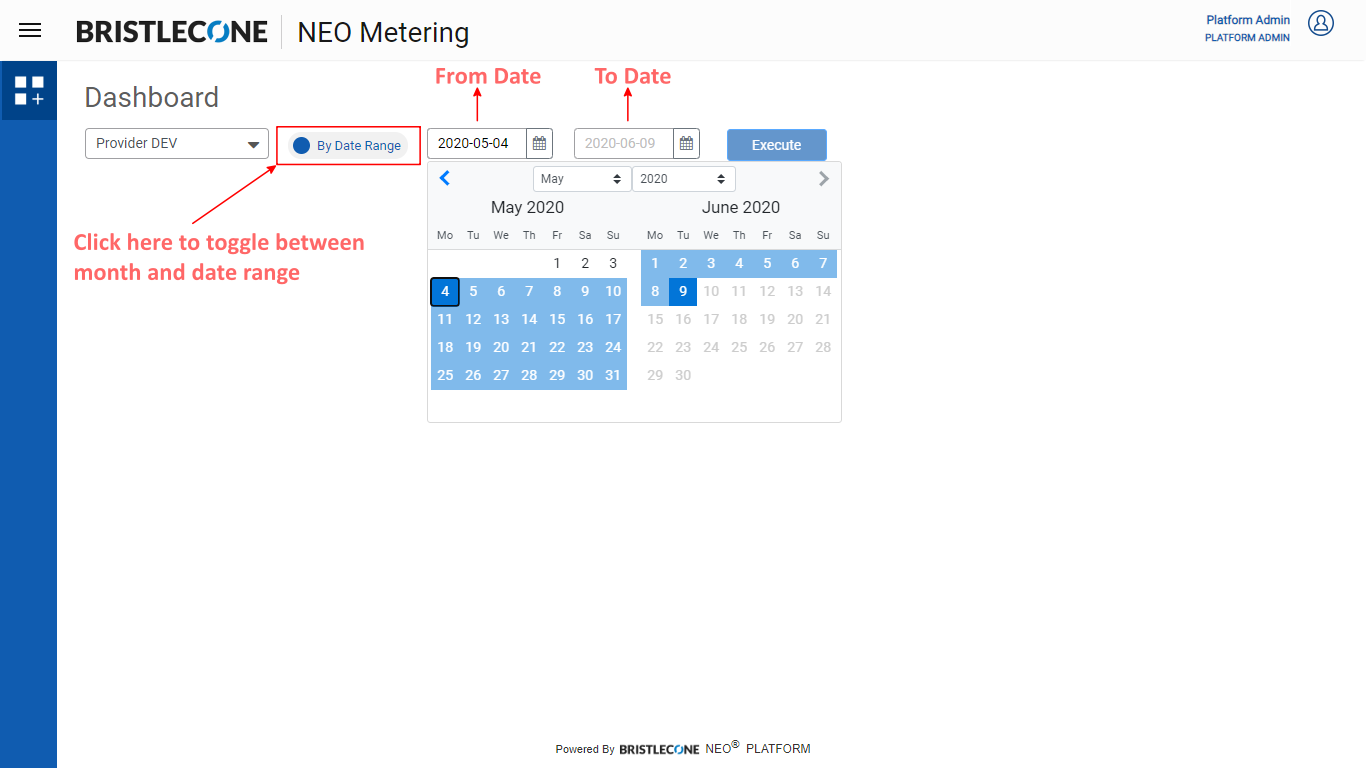
By Date Range
To view the report By Date Range, toggle the button from By Month to By Date Range as shown in the below figure. Once toggled to By Date Range, select the from date and to date from the calendar.
To view the report, Platform Admin can click on Execute button
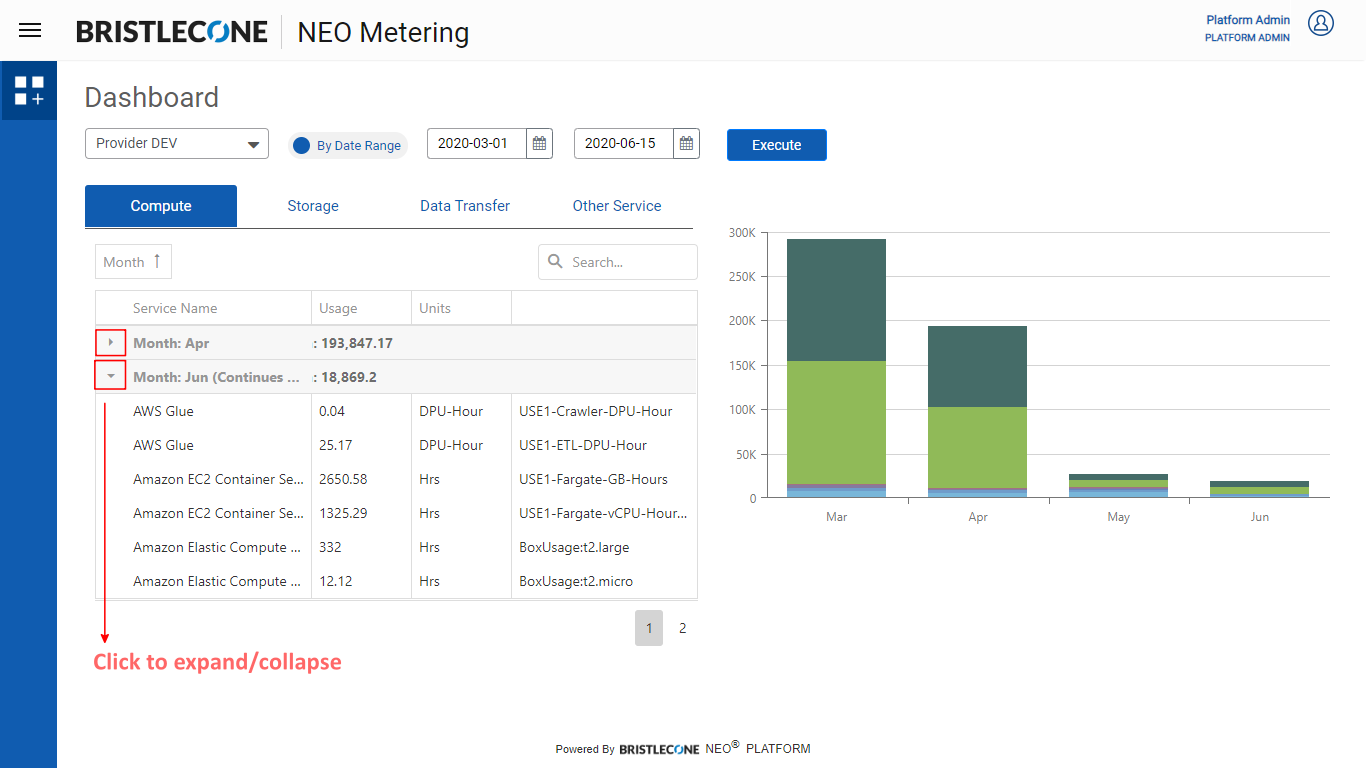
Post click, the dashboard will appear with usage details along with Bar graph to view the month wise usage as shown below:
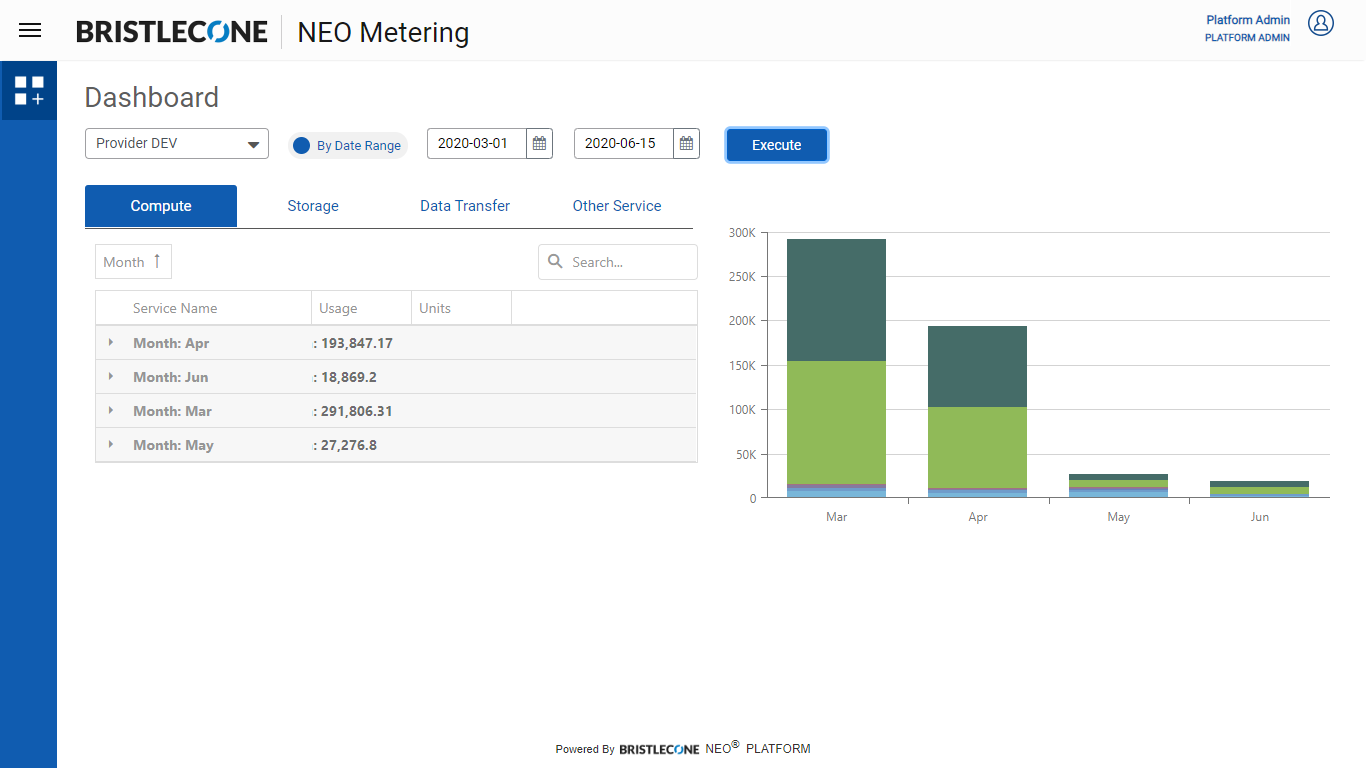
Platform Admin can switch between different tabs (Compute, Storage, Data Transfer and Other Services) to check the related Services Name and their usages, units and description in a table view. For each tab the related Bar graph will appear on the right side of the screen. Hovering mouse on the different color of the bar graph will show brief details about the service
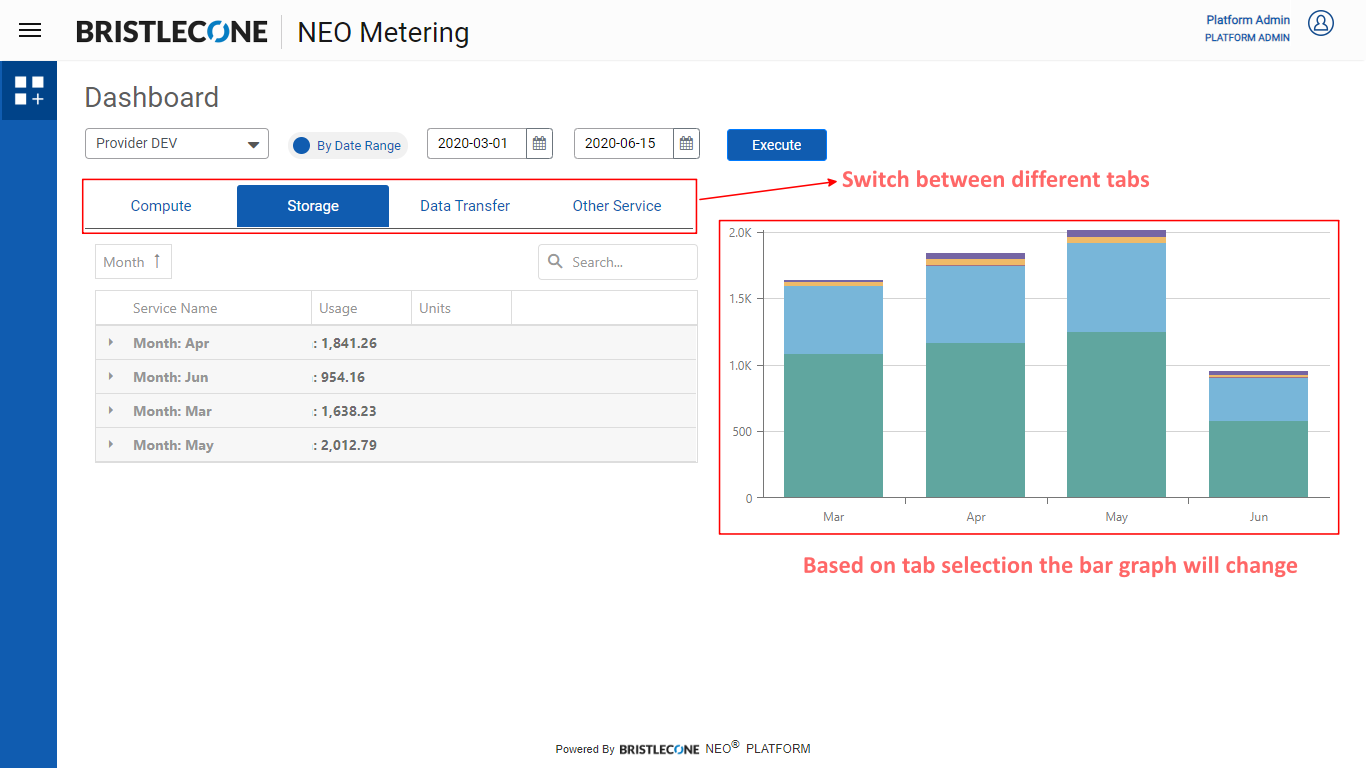
To view the detailed report month wise, click on the down arrow icon of each month to expand the report and view the service usages of the month
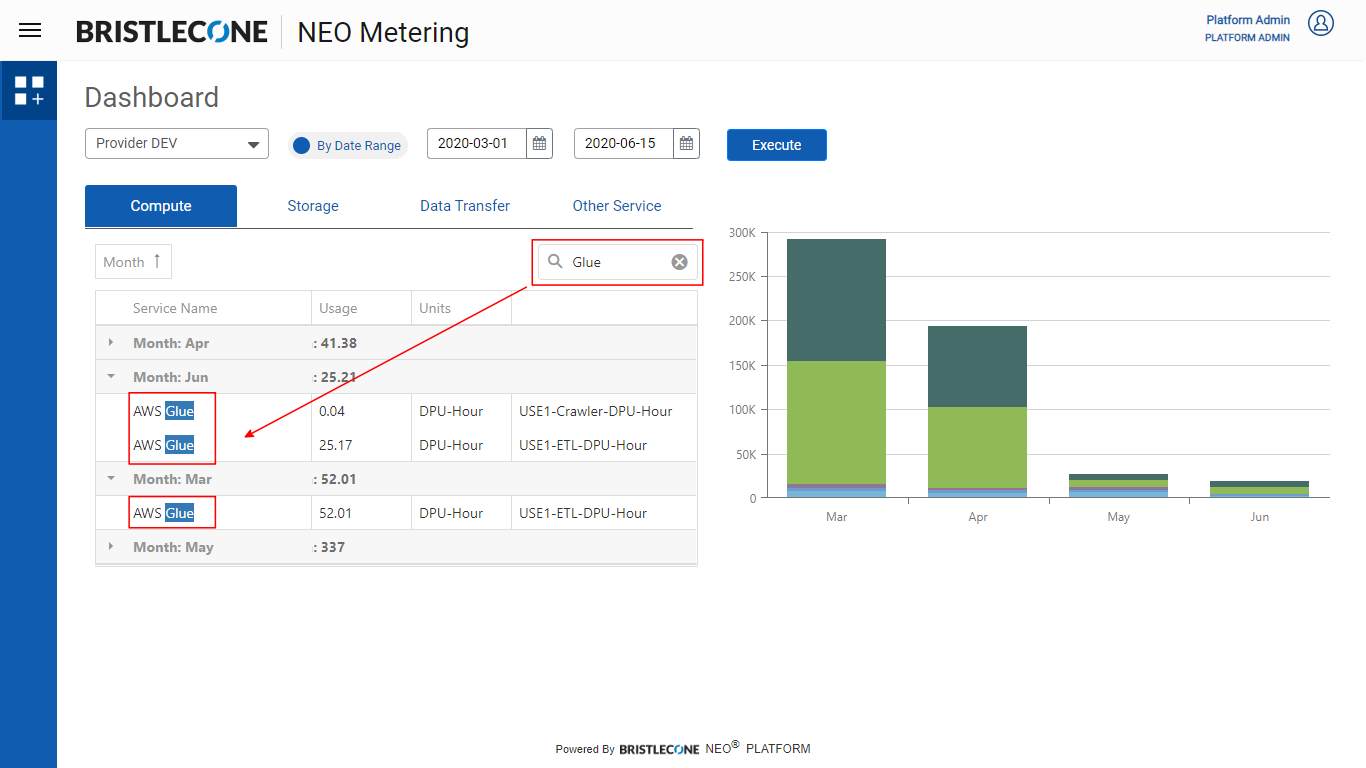
Search
Platform Admin can perform search operation by typing the service name in Search box and related search results will automatically appear under each month (As per date range selected). Click the same down arrow icon of the months to view individual month’s usage of that service
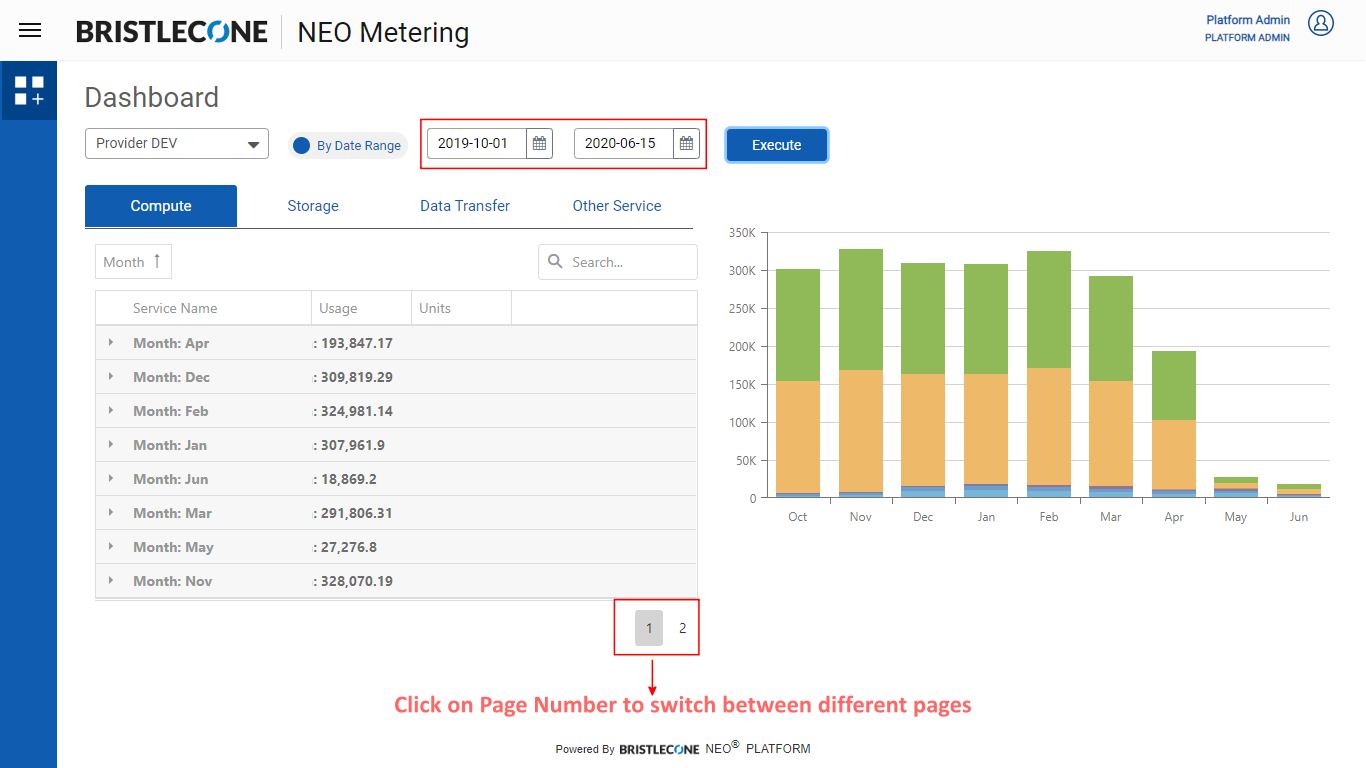
Pagination
Based on the number of searches the content can appear in discrete pages. Click on the page numbers to switch between different pages
Logout
To logout from NEO metering app, click on Profile icon and then click “Log Out”